Subquery with Lookup transformation in SSIS
Sometimes it is required to run additional subquery somewhere in a middle of the Data Flow Task. Suppose that we have some complex SQL select logic at the Data Flow Source when we initially getting hold of our data, then a few transformations down the way (maybe a conditional split or two, merge or union) and suddenly we realize that we need to support our next transformation logic based on the results of the subquery that we need to run exactly now, at this point and not at the source or anywhere before. I was looking into posts explaining on how to implement a subquery but they were all utilizing Script Component or stored procedure’s OUTPUT parameters. Wouldn’t it be nice to implement this quite a common requirement on the fly without complex coding and writing stored procedures.
select DepartmentID, count(*) DepartmentIDCount from OurTable
where DepartmentID = ‘000000’ –dummy department
group by DepartmentID

This query returns nothing and where clause submits the dummy Department ID. The query is required only for Lookup internal metadata generation which will allow us to connect input and referenced data sets in the Columns tab

The real query is provided on the Advanced tab and parameterized by Department ID
select DepartmentID, count(*) DepartmentIDCount from OurTable
group by DepartmentID where DepartmentID = ?


In the run-time a valid Department ID is provided and query returns the count of rows for each Department


This approach is not optimized since no caching involved, but can be suitable for a limited number of rows and in situations when Data Flow is complex or quick subquery is required.
One Cube, Different Dimensions, Different Data – with MDX
The previous business scenario (different sums by different dimensions based on UserName function) can be implemented with MDX only. Just to remind the business requirements: users login to cube, they all have access to different departments (can be one or many) and their data, users must be assigned only to one Master department, they can see overall VisualTotal when data sliced by any dimension but Merit, they can see only subtotal of VisualTotal (excluding Master department) when data sliced by Merit dimension in any variation. To support MDX-only solution, relational schema needs to be modified. DimLogins table now consists of 3 columns: LoginKey, LoginID, AccessToMerit. LoginKey is a primary key; LoginID holds user Login ID and AccessToMeritData holds one of the 3 values:"None", "Full" or "Partial". "None" – no Access to Merit data completely means when data is sliced by Merit general message "no access" shown. "Full" means full access to the Merit data including Master department, Partial – partial access to data (excluding Master department sub-total from overall VisualTotal) when sliced by Merit and full data when sliced by any dimension but Merit. In the cube, a hidden dimension named Logins is built which consists of two attributes: [Login] – key attribute and [Access To Merit Data] attribute. Intersection of the current User login and [Login].[Access To Merit].[Partial] member will define the scope for the Merit related calculation only, since neither "Full" nor "None" requires any special calculations. FactLogin table will hold combination of the LoginID keys taken from Login table, DepartmentID keys taken from DimDepartment table and a special flag column called IsMeritAccessible. This flag will indicate whether department is Merit accessible or should be excluded from the total when sliced by all dimensions but Merit and show "no access" when sliced by Merit. From this fact table, I built additional hidden dimension called [Merit Flag] with only one attribute – [Accessible Merit] with values False and True. Intersection of this flag with user login will generate sets of the accessible and not accessible department ID’s.
The first statement after CALCULATE command in Cube Calculations pane would be
–find current user LoginID
create hidden set login as StrToSet("[Login].[Login].[" + UserName + "]");
Since this statement will execute each time a new user connects to a cube, set "login" will hold current user’s LoginID. Next statement finds all departments that the current user has access to.
–find the current user’s Departments ID’s he has an access to
create hidden set Access as
NonEmpty([Department].[Department].[Department].Members,
(login, [Measures].[Fact Login], [Merit Flag].[Accessible Merit].[True])
);
Next statement finds all departments that the current user has NO access to.
–find the current user’s Departments ID’s he has an access to
create hidden set noAccess as
NonEmpty([Department].[ Department].[ Department].Members,
(login, [Measures].[ Fact Login], [Merit Flag].[Accessible Merit].[False])
);
I will need these two sets to create a hidden measure that will called for [Partial] scope only. Next comes the measure
–member that aggregates over the current measure within the Access set context
create member currentcube.[Department].[Department].AggregateCurrentMeasure as
aggregate(Access, Measures.CurrentMember),
visible = 0;
Next is the set that will create a tree consisting of no-accessible departments regardless of the Current Member level, starting from the highest level down to the leaves
–build the [Department] branch to which a current user has no access
create hidden set noAccessMembers as
union (generate(noAccess, ascendants(noAccess.Current)),
descendants (noAccess));
Finally comes the scope calculation
–check if current Merit member is not All Member (this indicates that user is slicing by Merit)
if not ([Merit].[Merit].CurrentMember is [Merit].[Merit].[All Merit])
and
–check if current user has only partial access
(count(exists(login, [Logins].[Access To Merit].[Partial])) > 0)
then
–if current member is ALL (this indicates that user is not slicing by Department) then aggregate over Access set
this = iif([Department].[ Department].CurrentMember is
[Department].[ Department].[All Departments]
,
–aggregate over Access set here
[Department].[ Department].AggregateCurrentMeasure,
–otherwise if user is slicing by Department
–and current department is restricted – show "no access",
–if current department is not restricted – return current measure
iif(count(intersect([Department].[ Department].CurrentMember, noAccessMembers)) > 0
, "no access"
, Measures.CurrentMember)
)
end if;
–if no access – return “no access”
if not ([Merit].[Merit].CurrentMember is [Merit].[Merit].[All Merit])
and
–check if current user has no access
(count(exists(login, [Logins].[Access To Merit].[None])) > 0)
then
this = "no access"
end if;
This script produces exactly the same results as the previous solution, only faster

One Cube, Different Dimensions, Different Data
Just started my new gig in NYC and already got some rather unusual requirements related to the cube data security. Client has a small cube with one secured dimension (call it Org Structure) and one special dimension (call it Merit) which when sliced by, should behave slightly different from the rest of dimensions.
A user can have access to one or several departments. No matter how many departments user has access to; one department is always a Master department for him/her. User has access to data for all departments when sliced by any dimension except Merit, and data for all departments except Master when sliced by Merit dimension. Let me put that requirement in Excel for better visualization.

Here, all data is freely accessible when sliced by any dimension (except Merit); in this case by Org Structure. You can see that Master department data contributes to the total and there is no restrictions applied to the data visibility. Results should change when we slice by Merit dimension:

Noticed the difference in the total? When we slice by the Merit dimension, we should not have access to the Master department data, since this data is highly sensitive for a user and must be hidden. Take a look at another picture:

Any time user is using Merit dimension, data is recalculated to reflect new values without master department figures.
My solution consists of two almost identical cubes (which will source their data from the same relational database) and a .NET component. One cube with security implemented will be facing users answering the majority of the requests, whereas the second will be contacted via .NET stored proc only when request by the Merit dimension is submitted. The second cube will have no security restrictions and will stay hidden for the users. The reason why we would need a second cube is simple: infinite recursion. It’ll be clear soon.
First of all, we need to know when we slice by Merit department, so we apply our calculations to this dimension only. This easily can be achieved by using Scope statement in the cube script. My initial scope statement looked like this:
scope ([Measures].[Measure] *
[Merit].[Merit].Members);
if not ([Merit].[Merit].CurrentMember is
[Merit].[Merit].[All Merits])
then
this = sum(NonEmpty([Org Structure].[Org Structure Key].Children,
(StrToMember("[Logins].[Login].[" + userName + "]"),
[Measures].[Login OrgStructure]
)
)
)
end if;
end scope;
Here, I have my security filter added, so I thought that I would be able to obtain results from the same cube, but when SSAS is trying to resolve [Merit].[Merit].CurrentMember it is running the same scope statement eventually falling into infinite recursion. This is how I came up with an idea of having another cube. I would write .NET stored proc, obtain the tuple of the current cell by using ADOMDServer library, build dynamic MDX, and open ADOMDClient connection to the second cube to execute my query. This path needs to be run for every cell on the report, so when users want to drill down their results to the lover levels, execution time will linearly increase.
Here is my final scope statement with the call to the .NET proc added.
scope ([Measures].[Measure] *
[Merit].[Merit].Members);
if not ([Merit].[Merit].CurrentMember is
[Merit].[Merit].[All Merits])
then
this = MeritSecurity.GetMerit(
"Provider=MSOLAP.4;Initial Catalog=hidden cube;Data Source=myserver100"
)
end if;
end scope;
Here is the .NET proc code and it’s well-commented
Imports Microsoft.AnalysisServices.AdomdServer
Public Class MeritSecurity
Public Function getMerit(ByVal connectionString As String) As String
Const COMMA As String = ","
Dim selectTuple As String = String.Empty
Dim whereSlicer As String = String.Empty
Dim result As String = String.Empty
Dim currentCellAddressTB As New TupleBuilder
Dim currentCellAddressM As MemberCollection
‘get the current user name
Dim userName As String = New Expression("Username()").Calculate(Nothing).ToString
‘build the sub-select slicer with the security filter
whereSlicer = "(NonEmpty([Org Structure].[Org Structure Key].Children, " + _
" (StrToMember(""[Logins].[Login].[" + userName + "]""), " + _
" [Measures].[Login OrgStructure])) ) on 0 from [hidden cube])"
‘go over the current context and collect all current members into tuple bulder
For Each currentDimension In Context.CurrentCube.Dimensions
For Each currentHierarchy In currentDimension.Hierarchies
currentCellAddressTB.Add(currentHierarchy.CurrentMember)
Next
Next
‘place all members into a member collection
currentCellAddressM = currentCellAddressTB.ToTuple.Members
‘build select tuple for the current cell
For Each currentMember In currentCellAddressM
selectTuple += currentMember.UniqueName + COMMA
Next
‘get rid of the last comma and close the tuple
selectTuple = "(" + Left(selectTuple, selectTuple.Length – 1) + ")"
‘get all ADOMDClient objects to run query against the second cube
Dim SSASconnection As New Microsoft.AnalysisServices.AdomdClient.AdomdConnection
Dim SSAScommand As Microsoft.AnalysisServices.AdomdClient.AdomdCommand = + _
SSASconnection.CreateCommand()
Dim SSASDataReader As Microsoft.AnalysisServices.AdomdClient.AdomdDataReader
SSASconnection.ConnectionString = connectionString
SSAScommand.CommandType = CommandType.Text
‘build the final query
SSAScommand.CommandText = "select " + selectTuple + " on 0 from " + whereSlicer
SSASconnection.Open()
‘RUN IT FINALLY…
SSASDataReader = SSAScommand.ExecuteReader()
Try
If SSASDataReader.Read() Then
result = SSASDataReader.GetString(0)
Else
result = "no access"
End If
Catch ex As Exception
result = String.Empty
End Try
SSASconnection.Close()
Return result
End Function
End Class
This will work, returning different results when data is sliced by different dimensions. As I’ve mentioned, this can and will impact query time dramatically, but client really wants this functionality to be somehow inplemented.
Any feedbacks will be appreciated
Fact table load failure. Business keys logging
When we load data into data mart, the usual sequence of events is:
- Update dimension tables with new or modified records. If a new record is added, a new surrogate key is generated in the dimension table. (Business keys are stored in dimension table as well to historically group surrogate keys (SCD Type 2) and provide surrogate key lookup functionality during fact table load process)
- Load fact table: first, select business keys along with measures from data source(s), then replace business keys with surrogate keys by looking them up from dimension tables and finally, load surrogate keys along with measure data into the fact table.
Sometimes, when a data warehouse fact table is in process of loading, the SSIS Lookup Transform (if used) fails to match business key and doesn’t return surrogate key from looked up dimension table. This may happen in the case of the early arriving facts (inferred records) or errors during dimension load process. Naturally, users want to track those faulty business keys and often request to implement the logging framework which will persist relevant record metadata for further analysis. Knowing that many fact tables with different granularity and number of keys exist even in the simplest data warehouse environment, this solution could require a round of thought. The following strategic questions should be answered as early in development stage as possible:
- Should we create multiple error log tables(one per fact table) or just one to accommodate it for all existing fact tables?
- What information should be stored in the error log table(s) to provide the most usable content?
- How do we populate the error table(s)?
Here, I want to share my solution of the business key logging functionality which provides all necessary metadata for a data problem identification, has low maintenance overhead and straightforward development approach.
Lets say we have a small data mart with only three dimensions and one fact table. The table structure is very simple:
CREATE TABLE [dbo].[_DimProduct](
[ProductID] [int] NULL,
[ProductBusinessKey] [varchar](10) NULL,
[ProductName] [varchar](50) NULL
)
CREATE TABLE [dbo].[_DimLocation](
[LocationID] [int] NULL,
[LocationBusinessKey] [varchar](10) NULL,
[Location] [varchar](50) NULL
)
CREATE TABLE [dbo].[_DimDate](
[DateID] [int] NULL,
[DateBusinessKey] [varchar](10) NULL,
[Date] [varchar](20) NULL
)
CREATE TABLE [dbo].[_FactProductLocationDate](
[ProductID] [int] NULL,
[DateID] [int] NULL,
[LocationID] [int] NULL,
[Sum] [int] NULL
)
Additionally, we need a Fact Source table (in a real life, that would be a number of Source OLTP tables with many joins between them). This table will play role of the real data source and will consist of business keys and measures only. Our task is to bring this data into our data mart by performing surrogate key lookup on each business key column and then loading surrogate keys and intact measures into our fact table.
When the SSIS Lookup transform is configured to redirect current row on Lookup Error, it will return NULL for the requested fields(in our case: surrogate key only) when business key match is not found, and then it will redirect the entire row to the Lookup Error Output path.
CREATE TABLE [dbo].[_FactSource](
[ProductBusinessKey] [varchar](10) NULL,
[DateBusinessKey] [varchar](10) NULL,
[LocationBusinessKey] [varchar](10) NULL,
[Sum] [int] NULL
)
Now it’s time to design our Error Log table(s). We need to decide, whether it will be one or many error log tables. My thought was that creation one error log table for each fact table will introduce schema navigation overhead, so my decision is to stay with only one error log table per data mart. Since this will be only one table, it needs to be flexible enough to accommodate any error data potentially coming from different fact tables.
Let’s talk about the set of fields this table should have. We want to know exactly which business key failed and its value, name of the Lookup transform redirected the erroneous row, name of the package where it occurred and time of the accident. The following columns will be added to the _ErrorLog table:
- ErrorLogID – identity column: will be generated by the _ErrorLog table
- FailedBusinessKey – this column should be able to store any value of the faulty business key, and business key can be of different types (usually String or Numeric), so I made it String to make it flexible
- FailedBusinessKeyColumn – stores name of the business key column ("LocationBusinessKey", "ProductBusinessKey", etc)
- FailedLookupName – stores name of the SSIS Lookup transform
- FailedDimensionTable – stores name of the dimension table that failed to return surrogate key.
- PackageName, PackageRunDate and UserName – additional metadata about the SSIS package that encountered the lookup problem
Here is the final structure of the ErrorLog table:
CREATE TABLE [dbo].[_ErrorLog](
[ErrorLogID] [int] IDENTITY(1,1) NOT NULL,
[FailedBusinessKey] [varchar](10) NULL,
[FailedBusinessKeyColumn] [varchar](50) NULL,
[FailedLookupName] [varchar](50) NULL,
[FailedDimensionTable] [varchar](50) NULL,
[PackageName] [varchar](50) NULL,
[PackageRunDate] [datetime] NULL,
[UserName] [varchar](50) NULL
)
This is how the SSIS package looks after Lookup Error Logging functionality has been added to it:

All Lookups are configured to redirect bad records to the Error Output, each followed by a Unique Derived Column transform. Let’s look at one of them and see what fields it’s adding to our Error Output data flow

Inside of the "Product Unique columns" Derived Column transform we have set of custom fields, each related to the same _ErrorLog table columns
- FailedBusinessKeyColumn – hardcoded value, provides name of the source column that contained failed BusinessKey. In our example it is "ProductBusinessKey"
- FailedLookupName – hardcoded value, provides name of the failed Lookup transform
- FailedBusinessKey – provides value of the failed Business Key. This field is a String type since business keys can be of different types and String type is the most flexible one.
- FailedDimensionTable – hardcoded value, provides name of the dimensional table failed to provide valid Surrogate Key.
As you can see, 3 out of 4 fields are hardcoded, but gives us very detailed information about the error, and definitely worth of time creating them. Of course, all hardcoded values need to be changed for each Unique Derived Column transform accordingly to provide specific information about each Lookup.
Since Derived Colum task produces new data fields of the Unicode type, I used type cast expressions to convert Unicode to String. This will save me some time, package space as well as buffer size by not using additional Data Conversion transform.
Since all our derived columns generated by Unique Derived Column trasforms have the same names, we can easily map all outputs by using Union All transform.

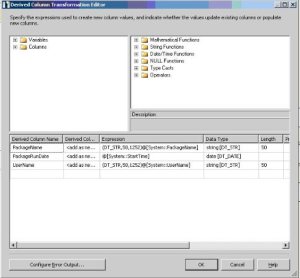
Right after Union All transform, I used additional Derived Columns transform which adds more fields to our Error Output data flow which will map to the rest of the _ErrorLog table columns
- PackageName – name of the package encountered lookup problem.
- PackageRunDate – date and time of the package run when lookup problem occurred
- UserName – account user name that run SSIS package
All that information is provided from the SSIS package System variables: [System::PackageName], [System::StartTime] and [System::UserName] respectfully.
Now, if we run our package loading good and erroneous data, you can see that some rows were redirected to the Error Output path and were stored in the ErrorLog table


Now, we know exactly where the problem occurred: package, lookup transform, table, field and even its value (user name too) that prevented us for successful fact data load.
Conclusion
It is almost always necessary to provide data logging capabilities during data warehouse load process. Data analysts, DBA’s and business users need functionality to trace back erroneous data and perform data validation tasks as soon as possible. The more detailed information they have, the less time will be required for them to address the problem at hand. In this article, I provided simple, yet flexible, step-by-step solution that allows us to store metadata related to problematic data records which fact table load process may encounter.
ParallelPeriod + PeriodsToDate = Unexpected exception
Apparently, I have no luck with ParallelPeriod() function again, but now, on how it works together with PeriodsToDate() function. This example is run on SSAS 2005 SP2 and I didn’t have chance to run it on SSAS 2008 yet, so very possible, it’s not an issue anymore.
A very harmless, at first sight MDX combination, left me in limbo and I wish I knew more about internals of query parsing and resolving process. Let’s say, I am collecting my data at the Week level and I want to calculate rolling measure by using PeriodsToDate function. My first calculation member looks like this:
member firstQTD as
aggregate(PeriodsToDate([Date].[Marketing Calendar].[Market Quarter])
, [Measures].[MyMeasure])
Now, I want to calculate firstQTD for the previous year. So, here is the second member:
member QTD_LY as
(firstQTD, ParallelPeriod([Date].[Marketing Calendar].[Market Year]))
or even:
member QTD_LY as
(firstQTD,
ParallelPeriod([Date].[Marketing Calendar].[Market Year], 1,
[Date].[Marketing Calendar].CurrentMember))
Very basic. But when I run my query:
with
member firstQTD as
aggregate(PeriodsToDate([Date].[Marketing Calendar].[Market Quarter])
, [Measures].[MyMeasure])
member QTD_LY as
(firstQTD, ParallelPeriod([Date].[Marketing Calendar].[Market Year]))
select
{{
[Date].[Marketing Calendar].[Market Week].&[200821],
[Date].[Marketing Calendar].[Market Week].&[200921]} *
{
firstQTD, QTD_LY
}}
on 0,
non empty [MyDimension].Members on 1
from [Cube]
I get something totally unexpected to me and to SSAS internals. Literally:
Executing the query …
Internal error: An unexpected exception occured
Execution complete

By rewriting my query, I’ve got some explanation of the internal info about the error:
Executing the query …
Internal error: An unexpected error occurred (file ‘mdevaluator.cpp’, line 2721, function ‘MDDisjointUnionEvaluator::AddSplit’).
Execution complete
The new query is:
with
member firstQTD as
aggregate(PeriodsToDate([Date].[Marketing Calendar].[Market Quarter],
[Date].[Marketing Calendar].CurrentMember)
, [Measures].[MyMeasure])
member QTD_LY as
(firstQTD, ParallelPeriod([Date].[Marketing Calendar].[Market Year], 1,
[Date].[Marketing Calendar].CurrentMember))
select {QTD_LY} on 0,
{
[Date].[Marketing Calendar].[Market Quarter].&[2009]&[1].Children,
[Date].[Marketing Calendar].[Market Quarter].&[2009]&[2].Children
}
on 1
from [Cube]
By rewriting the firstQTD and making it inelegant and equal to:
member secondQTD as
aggregate({ancestor([Date].[Marketing Calendar].CurrentMember,
[Date].[Marketing Calendar].[Market Quarter]).FirstChild :
[Date].[Marketing Calendar].CurrentMember}
, [Measures].[MyMeasure])
, I’ve got my both queries running, and myself puzzled:

This left me thinking about ability (tool) for a regular developer to look inside of the code parsing process and be able to at least follow the code flow or something….
Any ideas on what happened to my query?
Create New SSAS Partition dynamically: XML Task
There is a good number of posts exist on how to create and manage new SSAS partitions dynamically, but almost all of them based on AMO coding and may look intimidating to some folks especially with little .NET skills in the past but expert DBA skills presently J. Knowing my programming background, I was "kindly" asked to provide a framework for dynamic partition creation with as little code implementation as possible, so it can be maintained by a person with a different skill set. Let’s think a bit: SSAS partition object can be scripted as XMLA script, some XMLA tags can be replaced dynamically to ensure partition uniqueness, SSIS XML Task has Operation Type – Merge… Ok, enough thinking J
Assume, that we want to create a new partition for each new year of data. We will need a simple cube with at least one QueryBinding partition already created and having WHERE clause, just to generate our version of partition XMLA (original partition can be deleted after we are done), something like this:

As you can see, there are just a few dynamic parts that can be replaced on the fly to make partition script fully dynamic, the list is highlighted: Partition ID, Partition Name, WHERE clause and Partition Slice. SSIS XML Task Merge operation can add new tabs to a XML document, so basically, idea here is to add all dynamic parts in the run time and send the final script to the SSAS for execution. Let’s try to do that. First, we create a Master XMLA partition script template by deleting all dynamic tags and store it somewhere in the share folder. So, the Master script template will look like this:

As you can see, there is no Partition ID, Name or Slice tags in it, as well, WHERE clause got modified by replacing actual Year value with "####" mask. Additionally, <Create> tag had xmlns="http://schemas.microsoft.com/analysisservices/2003/engine" attribute, but looks like XML Task can’t read the entire XML when this attribute is present, so I was forced to remove it while building dynamic XMLA with XML Task and restore it right before sending final XMLA script to the SSAS, since SSAS won’t process <Create> command without it. Next, I built a simple SSIS package with 5 tasks and 5 variables.

Package Variables are set up and configured in the following way

For example, Node_PartiitonID variable’s Expression property is set to "<ID>Transaction_" + @[User::CurrentYear] + "</ID>" to build partition ID based on the current Year.
[Add Partition ID] XML Task is configured as follows and self-explanatory.

Here, I connected to my Master XMLA template, went to /Create/ObjectDefinition/Partition XPath and inserted value taken from [User::Node_PartitionID] variable. After all this, I saved results of generated XMLA script to [User::XMLA] variable. In the next two tasks, I am sequentially adding Partition Name and Partition Slice to a in-variable script, each time modifying and saving final version of XMLA variable contents. Configuration for the [Add Partition Slice] looks like this.

Here, source is [User::XMLA] variable of course, not initial version of the Master.xmla file. The task before the last one is the Script Task. We need to add some final details to the almost-ready-for-the-run XMLA script. Couldn’t avoid using .NET completely, J
Public Sub Main()
‘year mask
Const YEAR_MASK As String = "####"
‘get current year
Dim sCurrentYear As String = _
Dts.Variables("User::CurrentYear").Value.ToString
‘replace #### mask with current year value
Dim sXML As String = _
Dts.Variables("User::XMLA").Value.ToString.Replace(YEAR_MASK, sCurrentYear)
‘add before droped xmlns attribute back to <Create> tag
sXML = sXML.Replace("<Create>", _
"<Create xmlns=""http://schemas.microsoft.com/analysisservices/2003/engine"">")
‘store modified script back to var
Dts.Variables("User::XMLA").Value = sXML
Dts.TaskResult = Dts.Results.Success
End Sub
The last task sends our final XMLA script to the SSAS server.
All this framework (5 tasks) can be placed inside a For Each Loop container, which will loop over all years that require new partition creation. The logic on how to find these years may be implemented differently, depending on overall system requirements and SSAS version. This can be done by reading a list of existing partitions from DMV, or SSIS can be configured not to fail if partition already exists, etc.
Of course, this solution has it’s own drawbacks: partitions can be created sequentially only and not in parallel, but if requirements for partition creation are moderate, like in our case, then it’s good enough. Another one is a maintenance of the Master XMLA template, but my answer to this: if DBA’s are already managing thousands of scripts, then one or few more is not a big deal at all J. Nonetheless, the main demand is achieved: no or little of .NET "nightmare".
Weighted Average: from requirements to implementation
Just a few days ago, I was given a very typical request to calculate common business measure: Weighted Average. Usually, business folks give their verbal explanation of the problem along with their way of calculation and provide us developers with at least a formula or an Excel spreadsheet that explains in detail what is required and how it’s solved by example. Since, almost all people who are new to MDX script struggle to tackle such requests, and because I was asked several times on how I did it, I decided to provide a step-by-step explained development process of converting Excel logic to a MDX implementation and to be able to show how a typical problem can be solved and even optimized to a certain extent.
As a business scenario, lets say that potential customers inquire (call, browse web, email, etc) for some service and eventually some percent of those people subscribe for it. In our cube we have 2 regular measures: Inquiry and Subscription. We record our data at the Month level and need to calculate Conversion (# of Subscriptions divided by # of Inquiries) Weighted Average at all levels above the Month level (Quarter, Year and All Dates). It’s better to grasp by looking at the Excel spreadsheet

There are several formulas presented here. The first one is simple and it’s getting applied at the intersection of the Month level and [Conversion Ratio we need]

We simply divide the number of Inquiries by the number of Subscriptions and we get our Conversion Ratio at the Month level. So, typical MDX expression to calculate this would look like this:
create member currentcube.Measures.[Conversion Ratio] as
iif([Inquiry Count] = 0, null,
[Measures].[Subscription Count] / [Inquiry Count])
, format_string = "#.00%", visible = 0;
Second calculation will be involved in overall calculation of our Conversion Weighted Average and provide us with the ratio of Number Subscriptions at the current to a Number of Subscriptions at the Calendar parent level

This calculation works like the following:
create member currentcube.Measures.[Subscription % to Parent] as
iif(([Date].[Calendar].CurrentMember.Parent, Measures.[Subscription Count]) = 0, null,
([Date].[Calendar].CurrentMember, Measures.[Subscription Count])
/
[Date].[Calendar].CurrentMember.Parent, Measures.[Subscription Count]))
, format_string = "#.00%", visible = 0;
Here we use the Parent reference of the current member to get Subscription Count at the higher level and check whether this calculation is not equial to 0 since it used as a denominator and we want to avoid 1/0 error.Now comes the most interesting calculation: the final Conversion Ratio at the levels higher than Month level:

Looks like the Weighted Average at the higher level is not as simple as we thought (sum of children divided by their count): first it requires us to calculate Conversion Ratio than the mentioned above [Subscription % to Parent], calculate their product and only then – sum results of all children. And it should work at all levels above the Month level…
How do we approach this problem? We know that eventually we are going to use SUM() function, but how to implement earlier calculations inside it? SUM function expects mandatory set and additional <Numeric_Expression> parameter. If that parameter is there, inside of that numeric expression, we iteratively can get access to any member from the set (provided as a first parameter), meaning that we have flexibility to calculate any expression for a current set’ member in question. This and some other functions create their own calculation context, which allows us to provide complex calculations with ease. So, my first pass was like that – I wanted to calculate something, for example, at the Quarter and Month levels. First, I created empty calculated member
create member currentcube.Measures.[Conversion Ratio we need] as "NA";
then I oppened a new scope and provided calculations for the Month level. This will work as a simple assignment of already existing calculated member:
scope(Measures.[Conversion Ratio we need]);
this = Measures.[Conversion Ratio];
format_string(this) = "#.00%";
end scope;
then, inside of that scope, another scope is added to narrow down my first calculations to the Quarter level
scope(Measures.[Conversion Ratio we need]);
this = Measures.[Conversion Ratio];
format_string(this) = "#.00%";
scope([Date].[Quarter].Members);
this = sum(descendants([Date].[Calendar].CurrentMember,
[Date].[Calendar].[Month]),
–<numeric expression> parameter
([Measures].[Conversion Ratio] *
[Measures].[Subscription % to Parent]));
format_string(this) = "#.00%";
end scope;
end scope;
here, inside <numeric expression> we accessing every Quarter’s Month and calculate our product of [Conversion Ratio] and [Subscription % to Parent]. Since our scope is working at the Quarter level and providing additional scopes for Year and All Dates levels would be redundant, I expanded calculation scope to all levels above Month level. Scope definition looks like this now:
scope([Date].[Calendar].[All Dates] * [Date].[Year].Members * [Date].[Quarter].Members);
Another problem was to provide a proper set to a SUM function. Turned out that Weighted Average did not calculate properly at the Year and All Dates levels if always set of Months was provided to the SUM function. For calculations to work for each level, I modified calcs to provide a set of children of the current member only, so for example for a Year level, Year’s Quarters were passed, for All Dates – Years and so on. Therefore, instead of using descendants, I used
[Date].[Calendar].CurrentMember.Children
Finally, my calculation started to look very simple now. Here is the complete list:
create member currentcube.Measures.[Conversion Ratio] as
iif([Inquiry Count] = 0, null,
[Measures].[Subscription Count] / [Inquiry Count])
, visible = 0;
create member currentcube.Measures.[Subscription % to Parent] as
iif(([Date].[Calendar].CurrentMember.Parent, Measures.[Subscription Count]) = 0, null,
([Date].[Calendar].CurrentMember, Measures.[Subscription Count])
/
[Date].[Calendar].CurrentMember.Parent, Measures.[Subscription Count]))
, visible = 0;
create member currentcube.Measures.[Conversion Ratio we need] as "NA";
scope(Measures.[Conversion Ratio we need]);
–Month level only – (Quarter, Year, All Dates) will be overwritten by the second scope
this = Measures.[Conversion Ratio];
format_string(this) = "#.00%";
–all other levels (Quarter, Year, All Dates)
scope([Date].[Calendar].[All Dates] *
[Date].[Year].Members *
[Date].[Quarter].Members);
–will provide set of children for any
–level
this = sum([Date].[Calendar].CurrentMember.Children,
–will calculate product of ratios for each Calendar
–member
([Measures].[Conversion Ratio] * [Subscription % to Parent])
);
format_string(this) = "#.00%";
end scope;
end scope;
I can now run my query and get my Conversion Weighted Average as follows:

The purpose of this blog is to provide the development path, starting by analyzing requirements and finishing with working solution. Please comment if this solution can be optimized even further.
SUBCUBE vs. Slice for YTD()
When cube is built and developer wants to browse it quickly, often the first choice is SSMS or BIDS Browse view. By right clicking on the cube in SSMS Object Explorer and selecting the “Browse” option, a Browse view opens with Cube Metadata viewer, OWC and additional Filter pane, which altogether make cube navigation experience fast and simple as it can be. The Filter pane gives you ability to navigate the cube based on conditional operator (=, in, no in, etc) as well as with MDX expression and range selection. This is very flexible way of defining your filter conditions and definitely adds up value to overall user experience comparing it with OWC Filter selector which in turn allows only specific member selections. But what about MDX which is generated by both filters and sent over to the server? Is it the same when we use different filters for the same constrain?
Recently, I was testing my YTD and QTD calculated members created on the cube side along with real measures and unintentionally dropped week member on the Filter pane (not OWC Filter selector). Just to remind: for YTD, QTD, MTD to work properly, the Date CurrentMember needs to be selected at the level lower or equal to the function level(Year, Quarter or Month). Here is MDX for YTD and QTD calculated members:
CREATE MEMBER CURRENTCUBE.[Measures].[Actuals YTD]
AS AGGREGATE(YTD([Date].[Marketing Calendar].CurrentMember)
,[Measures].[Actuals]),
VISIBLE = 1;
CREATE MEMBER CURRENTCUBE.[MEASURES].[Actuals QTD]
AS AGGREGATE(PERIODSTODATE([Date].[Marketing Calendar].[Market Quarter],
[Date].[Marketing Calendar].CurrentMember)
,[Measures].[Actuals]),
VISIBLE = 1;
When I looked on the Results view, nothing was shown for YTD and QTD members. Real measure was showing some data.

Profiler is the first choice to see what the final MDX is that gets submitted to the server.


Looks like a SUBCUBE is created first to reduce the querying space and run subsequent queries in its context for a current Session. Name of the SUBCUBE is the same as name of the original Cube. After refreshing the new subcube and creating a temporary set of members to place on rows, a final query is submitted:


So, what is wrong with the query? Why YTD and QTD don’t work? Sure, SUBCUBE reduced querying space and I can run the following query to prove it.
create subcube [Enrollment] as
select ({ [Date].[Marketing Calendar].[Market Week].&[200924] })
on columns from [Enrollment];
select {} on 0,
[Date].[Marketing Calendar].Members on 1
from [Enrollment];
drop subcube [Enrollment];
Here is the results of the query:

The reason for YTD and QTD not returning any data is that although SUBCUBE has reduced the querying space, it is NOT resetting the DefaultMember to the member of choice (Week 24, 2009 in our case), nor providing any slices for CurrentMember as well. If I run:
with
member [Default Market Week] as [Date].[Market Week].DefaultMember.Unique_name
member [Default Marketing Calendar] as [Date].[Marketing Calendar].DefaultMember.Unique_name
member [Current Market Week] as [Date].[Market Week].CurrentMember.Unique_name
member [Current Marketing Calendar] as [Date].[Marketing Calendar].CurrentMember.Unique_name
select {[Default Market Week],
[Default Marketing Calendar],
[Current Market Week],
[Current Marketing Calendar]} on 0
from [Enrollment]
The defaults are still

Looking back to the final query that is submitted to the server, we can see that no slice for Date dimension is provided, leaving server to use Default Members implicitly. Since YTD and QTD are not working at (All) level, no data is returned for those calcs.
Results look different when Date member is provided for OWC Filter

Differently looks the final query as well:

Here is an explicit slice provided for the Date dimension, so YTD’s are working fine.
Filters are not the same and some calculated members can show different results depending on the type of the Filter used.
Date Dimension script optimized for Analysis Services KeyColumn property (Part 5)
This is the final part of our stored procedure
–plain cursor works faster than CTE
declare @CurrentYearKey smallint
declare flaotHolidays cursor fast_forward
for select distinct CalendarYearKey from @DimDate
open flaotHolidays
fetch next from flaotHolidays into @CurrentYearKey
while @@fetch_status = 0
begin
–Memorial Day
update @DimDate set Holiday = 1, HolidayName = ‘Memorial Day’
where DateKey = (select max(DateKey)
from @DimDate where CalendarMonthOfYearNum = 5
and DayNameOfWeekLong = ‘Monday’
and CalendarYearKey = @CurrentYearKey)
–Labor Day
update @DimDate set Holiday = 1, HolidayName=‘Labor Day’
where DateKey = (select min(DateKey)
from @DimDate where CalendarMonthOfYearNum = 9
and DayNameOfWeekLong = ‘Monday’
and CalendarYearKey = @CurrentYearKey)
–Thanksgiving
update @DimDate set Holiday = 1, HolidayName = ‘Thanksgiving’
where DateKey = (select (min(DateKey) + 21)
from @DimDate where CalendarMonthOfYearNum = 11
and DayNameOfWeekLong = ‘Thursday’
and CalendarYearKey = @CurrentYearKey)
fetch next from flaotHolidays into @CurrentYearKey
end
close flaotHolidays deallocate flaotHolidays
update @DimDate set RecordCreateDate = @CurrentDate,
RecordUpdateDate = @CurrentDate
–return the completed table as a result set.
select * from @DimDate
end
Once procedure is compiled on the server, a SSIS package can be build with one Data Flow task having OLE DB Source with SQL Command text as following:
exec [sp_PopulateDateDimension] ’01/01/2009′, ’12/31/2013′
Once package completes, table DimDate is populated with data with each level having it’s own key column that will be used while adding those levels as attribute hierarchies.

Therefore, instead of using Composite Keys as shown on the picture

, a Simple Key will be used providing more optimized key solution. Just don’t forget to order Month attribute hierarchy by the Key, not Name (default)
Date Dimension script optimized for Analysis Services KeyColumn property (Part 4)
calendar: starts on July 1st of the year calendar
FiscalYearKey = case
when CalendarMonthOfYearNum <= 7
then CalendarYearKey
else CalendarYearKey + 1
end,
FiscalSemesterOfYearNum = case
when CalendarSemesterOfYearNum = 1
then CalendarSemesterOfYearNum + 1
else CalendarSemesterOfYearNum – 1
end,
FiscalQuarterOfYearNum = case
when CalendarQuarterOfYearNum < 3
then CalendarQuarterOfYearNum + 2
else CalendarQuarterOfYearNum – 2
end,
FiscalMonthOfYearNum = case
when CalendarMonthOfYearNum < 7
then CalendarMonthOfYearNum + 6
else CalendarMonthOfYearNum – 6
end,
FiscalWeekOfYearNum = case
when CalendarWeekOfYearNum > 27
or CalendarMonthOfYearNum >= 7
then CalendarWeekOfYearNum – 26
else CalendarWeekOfYearNum + 27
end
–load rest of data for fiscal calendar
update @DimDate
set
FiscalWeekKey = cast(FiscalYearKey as char(4)) + right(‘0’ +
cast(FiscalWeekOfYearNum as varchar(2)), 2),
FiscalMonthKey = cast(FiscalYearKey as char(4)) + right(‘0’ +
cast(FiscalMonthOfYearNum as varchar(2)), 2),
FiscalQuarterKey = cast(FiscalYearKey as char(4)) + right(‘0’ +
cast(FiscalQuarterOfYearNum as varchar(2)), 2),
FiscalSemesterKey = cast(FiscalYearKey as char(4)) + right(‘0’ +
cast(FiscalSemesterOfYearNum as varchar(2)), 2),
FiscalYearLong = ‘FY ‘+ convert(char (4), FiscalYearKey),
FiscalSemesterOfYear1 = ‘FY H’ +
cast(FiscalSemesterOfYearNum as char(1)),
FiscalSemesterLong = ‘FY H’ +
cast(FiscalSemesterOfYearNum as char(1)) + ‘, ‘ +
cast(FiscalYearKey as char(4)),
FiscalQuarterOfYear1 = ‘FY Q’ +
cast(FiscalQuarterOfYearNum as char(1)),
FiscalQuarterLong = ‘FY Q’ +
cast(FiscalQuarterOfYearNum as char(1)) + ‘, ‘ +
cast(FiscalYearKey as char(4)),
FiscalMonthOfYear1 = ‘FY M’ +
cast(FiscalMonthOfYearNum as varchar(2)),
FiscalMonthLong = ‘FY M’ +
cast(FiscalMonthOfYearNum as varchar(2)) + ‘, ‘ +
cast(FiscalYearKey as char(4)),
FiscalWeekOfYear1 = ‘FY W’ +
cast(FiscalWeekOfYearNum as varchar(2)),
FiscalWeekLong = ‘FY W’ +
cast(FiscalWeekOfYearNum as varchar(2)) + ‘, ‘ +
cast(FiscalYearKey as char(4))
–holidays (fixed)
–New Year
update @DimDate set Holiday = 1, HolidayName=‘New Year’
where CalendarMonthOfYearNum = 1
and DayNumberOfMonth = 1 and CalendarYearKey
in (select distinct CalendarYearKey from @DimDate)
–4th of July
update @DimDate set Holiday = 1, HolidayName=‘4th Of July’
where CalendarMonthOfYearNum = 7
and DayNumberOfMonth = 4 and CalendarYearKey
in (select distinct CalendarYearKey from @DimDate)
–Christmas
update @DimDate set Holiday = 1, HolidayName=‘Christmas’
where CalendarMonthOfYearNum = 12
and DayNumberOfMonth = 25 and CalendarYearKey
in (select distinct CalendarYearKey from @DimDate);
–holidays (float) – CTE works slower than cursor and hence
commented
—-Memorial Day
–with MemorialDays as
–(select CalendarYearKey, max(DateKey) as DayKey from @DimDate
— where CalendarMonthOfYearNum = 5
— and DayNameOfWeekLong = ‘Monday’
— and CalendarYearKey
in (select distinct CalendarYearKey from @DimDate)
— group by CalendarYearKey )
— update @DimDate set Holiday = 1, HolidayName = ‘Memorial Day’
— where DateKey in (select DayKey from MemorialDays);
—-Labor Day
–with LaborDays as
–(select CalendarYearKey, min(DateKey) as DayKey from @DimDate
— where CalendarMonthOfYearNum = 9
–and DayNameOfWeekLong = ‘Monday’ –and CalendarYearKey
–in (select distinct CalendarYearKey from @DimDate)
— group by CalendarYearKey )
— update @DimDate set Holiday = 1, HolidayName = ‘Labor Day’
–where DateKey in (select DayKey from LaborDays);
—-Thanksgiving
–with Thanksgivings as
–(select CalendarYearKey, min(DateKey) + 21 as DayKey
–from @DimDate
— where CalendarMonthOfYearNum = 11
–and DayNameOfWeekLong = ‘Thursday’
–and CalendarYearKey
–in (select distinct CalendarYearKey from @DimDate)
— group by CalendarYearKey )
— update @DimDate set Holiday = 1, HolidayName = ‘Thanksgiving’
–where DateKey in (select DayKey from Thanksgivings);

